Seasonally Adjusted Data: Does It Make The Data More Useful?

The Data You Rely On Might As Well Be Picked From A Cloud

Employment Numbers Are A Driving Market Statistic

Twelve times a year the financial markets sit on the edge of their seats waiting for the release of the Non-Farm Payroll data. Stock prices can soar or sink, politicians can claim success or suffer negative headlines and in theory, businesses just might alter future business plans based on what they are seeing.

Earlier this month I asked if we live in a seasonally adjusted world:

https://ejmoosa.com/do-you-function-in-a-seasonally-adjusted-world/

What other aspects of our life are seasonally adjusted when we are given the data? Not many if any at all. You would not shop for a vehicle using seasonally adjusted pricing. Nor would you dress properly for winter with a seasonally adjusted forecast.

Magnitude of the Adjustments

Watching Fox Business News or CNBC and watching the guests discuss their estimates for the Non-Farm Payroll number, never did I imagine the magnitude of the adjustments being made. For example, if the estimates ranged from 175k to 250k, I thought the Seasonal adjustment might be 40-50,000. Not the magnitude I found. Let’s have a look:(remember that the Seasonally adjusted data released is the real number plus( or minus) the numbers for the month listed below):

Jan:  3,050,000

Feb:  (691,636)

March: (603,545)

April: (853,545)

May: (593,929)

June: (326,364)

July: 1,271,000

August: (156,700)

Sept.: (378,300)

October: (780,300)

Nov: (277,400)

Dec: 347,300

Seasonal Adjustments Leave False Impressions

Looking at just how large the adjustments are for each month is puzzling. Take a look at the average January adjustment listed :3,050,000. In reality, the economy could actually shrink by 2,000,000 jobs and the BLS will report that we added 1,050,000 jobs for the month of January. Does that make sense to you?

It makes no sense to be because what is reported and what is actually happening is not the same.

How do businesses make solid decisions on what is happening and what they should be doing to take advantage of the data if the data does not reflect the real world?

Is the American public too stupid to understand that lots of jobs are lost in January as the temporary Christmas jobs are terminated? Or do the seasonal adjustments mislead the Public because it is so easy to seasonally adjust giving people the perception of a more level and consistent economic environment?

What’s the Solution?

Because of the disconnect between Seasonally Adjusted Data and reality, I suggest we reduce the reliance on such misleading data. And to dump your investments in one sector and buy in another because of a blockbuster jobs number that is more a work of fiction than fact is likely a mistake.

But those that are profiting from this are those that make money when you buy and sell. They like this volatility created by the data because it causes knee-jerk reactions across the financial spectrum.

An obviously fictionalized number depicting economic activity that is anything but accurate is no way to manage your portfolio.

And that is the Naked Truth.

Inflation is Rising and Packaging is Shrinking

The Double Whammy of Inflation and Shrinkflation Are Just Getting Started

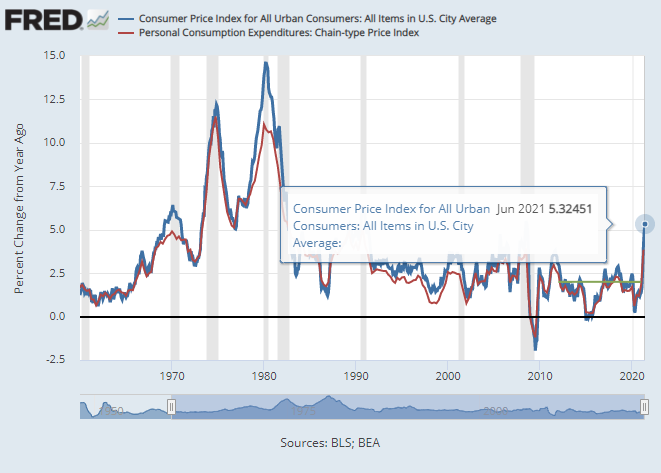
In a steep acceleration for prices where many people live, FRED is gracious enough to show us the rate of inflation for June 2021 along with a chart dating back well before 1970.

Source: https://research.stlouisfed.org/publications/page1-econ/2021/07/15/inflation-expectations-the-phillips-curve-and-the-feds-dual-mandate?utm_medium=email&utm_campaign=202108%20Research%20Newsletter&utm_content=202108%20Research%20Newsletter+CID_921402a9d24e9c41b5beabca068bd6cc&utm_source=Research%20newsletter&utm_term=Page%20One%20Economics%20essay

Ironies

Ironically, the story linked above justifies higher inflation than zero to prevent deflation(prices falling) yet if you look at the chart image, deflation has rarely been an issue over the last fifty years(2010).

Shrinkflation: What You Think You See May Not Be What You Get

Pictured below are two Tillamook Ice Cream containers. The product on the store shelves offered both containers for the same price: $5.99. That translates to an increase of 14.2% in price. Because the containers shrank and the prices are the same we call this Shrinkflation. And it stinks.

It stinks because unless you look carefully you might not notice the differences.

Shrinkflation: Same Price but a smaller Container. At least it has the same great taste, right?

Have you looked closely at your shredded cheeses lately? Choose carefully. While many are still 8 ounces(Two Cups) more and more are down to 7 ounces (or less).

Packages across the board are shrinking and this hides the real inflation we are seeing every day as they hold prices the same but you get less.

Hiding the inflation does all consumers a disservice. If the inflation is hidden from us, then we as consumers are not getting a clear perception of what our currency can and cannot buy.

Your dollars are losing their purchasing power. And at 5% or higher inflation, they will be losing that purchasing power faster than anyone has witnessed since the 1980s.

Unless you are getting salary increases to keep up with inflation, you and your family are going to be falling behind economically.

“Adjusted for inflation, hourly compensation fell 2.7 percent in the second quarter, data released by the Bureau of Labor Statistics on the nonfarm business sector showed Tuesday.” Source: Breitbart

Conclusion:

Choosing a rate of inflation at 2% or higher and calling your currency stable is simply false. Sooner or later the flames of inflation will jump the perceived control of the Fed and burh through the economy creating havoc and harm.

The US Dollar needs to be tied to a stable form of money such as gold, and interest rates need to be allowed to rise and fall as supply and demand dictate.

The damage we are doing to our economic well being will not be reversed any time soon and the cures for the damage are likely to accelerate the damage as we have seen in years past.

Do You Function In A Seasonally Adjusted World?

Seasonally Adjusted Data: Does it Help?

Last Friday (August 6,2021) the Bureau of Labor Statistics (BLS) released their preliminary jobs data for July and it was a doozy. The BLS reported that 943,000 jobs were added to the economy in July. 2021.

Sounds pretty impressive right? Too good to be true? Well, it really is too good to be true. Worse, it’s a lie.

Work in The Real Economy

In the real world where people get up and go to work and get a check for their labors is not seasonally adjusted. Fortunately, the BLS also shares that data(but no one else seems to notice it). Without the seasonal adjustments, the economy lost 133,000 jobs in July.

Let me repeat that: There were 133,000 fewer jobs earning pay in July than in June.

Seasonal Adjustments

Trying to think of what other aspects of our lives have seasonal adjustments I simply could not come up with any. We have seen that gasoline prices tend to rise in the summer and fall towards winter, but I’ve yet to hear any seasonal adjustments applied to the gas price to make these changes seem more palatable for us.

How Much Is This Seasonal Adjustment?

Non-Farm Payroll For July
NSASAAdjustment
2016-9733711344
2017-11032281331
2018-11641491313
2019-10581931251
202060617261120
2021-1339431076
Comparison of Job Numbers Adjustment 2016-2021

Million Plus Jobs Added Every July

As you can see in the table above, the BLS adds more than 1 million jobs every July. The jobs must be taken away during other months when we actually have created jobs. Does this lead to better decisions made by those that use this data? It’s hard for me to see how that is possible when the whole objective is meant to gauge the health of the US economy.

In our situation for July, we would have to lose more than 1 million jobs in July to even get close to showing no job growth. I find that simply stunning. Even in a terribly July, we’d still find solace that we were still adding jobs to the economy with the Seasonally Adjusted NFP (although we’d be lying to ourselves).

Using Unadjusted Numbers Paints a Different Picture

Would you have a different picture of the economy if we used the real data? Let’s look at this potential headline if we used the real data:

“July NFP Loses 133,000 Jobs Despite Low Interest Rates and States Re-Opening”

I think it speaks for itself. Don’t you? Somewhere, George Orwell is smiling knowing that he was right.

Corporate Profit Growth Continues to Sink

Corporate profit growth is an excellent indicator of the health of an economy. After all, the reason one is in business is to generally grow profits.

As I have written in years past Know Profit No Growth (No Profits No Growth)

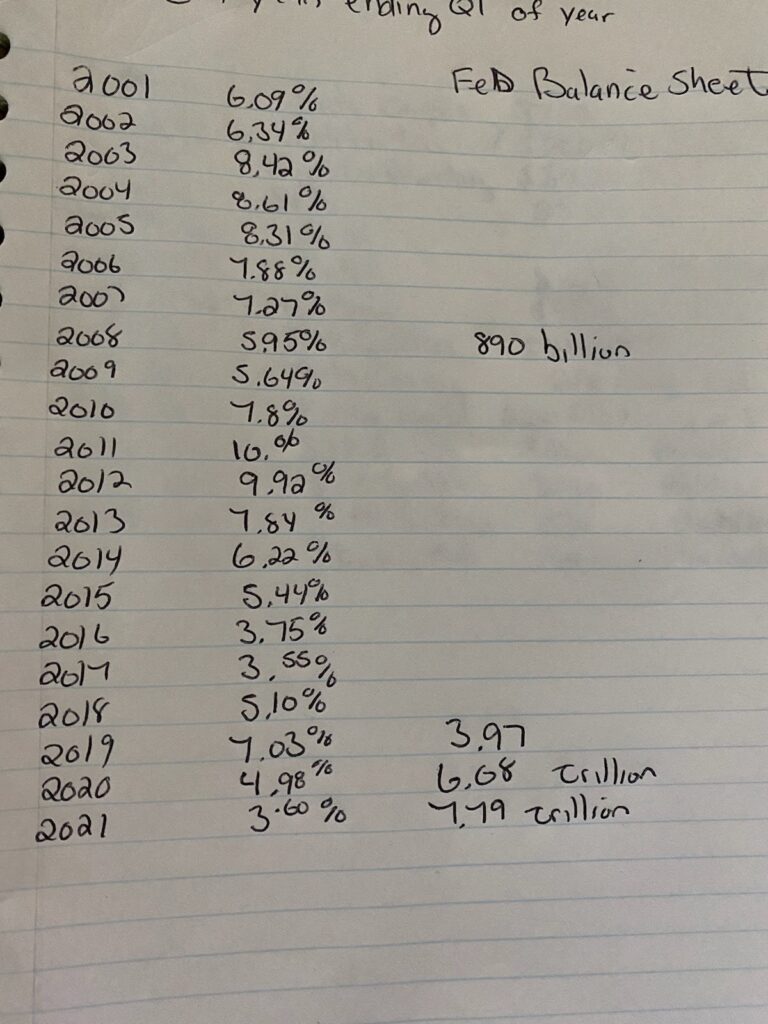
For the 10 years ending the first quarter of 2021, profit growth has fallen to 3.6% annually. Compare that to the ten years ending the first quarter of 2011 and you see just how poor we are doing: 10%.

Think about that. With all of the Fed easing, corporate tax cuts, ultra low interest rates and government giving out money, we have 1/3 of the growth of the previous decade.

So is the Fed keeping us afloat, or are they the cause of what ails us. I know what I believe. Below is an image of the rate of profit growth annually for the ten years ending in the year listed (first quarter each year). And for kicks, I’ve included the numbers of what the Fed balance sheet was along the way.